postrcspline
Author: Maarten L. Buis
The postrcspline package consists of programs that can help with the interpretation of a model that uses a restricted cubic spline as one of the explanatory variables by displaying a graph of the predicted values against the spline variable adjusted for the other covariates, or the marginal effects of the spline variable.
This package can be installed by typing in Stata: ssc install postrcspline
Supporting materials
- summary on ssc.
- helpfiles:
- Presentation at the 2009 German Stata Users' Group meeting on using the postrcspline package
- Announcement of postrcspline on statalist
Examples
The most basic syntax and the resulting graphs:
. sysuse uslifeexp, clear (U.S. life expectancy, 1900-1999)
. mkspline2 sp_year = year, cubic nknots(3)
. reg le sp_year* if year != 1918
Source | SS df MS Number of obs = 99 -------------+------------------------------ F( 2, 96) = 2126.16 Model | 7466.92497 2 3733.46249 Prob > F = 0.0000 Residual | 168.572512 96 1.75596367 R-squared = 0.9779 -------------+------------------------------ Adj R-squared = 0.9775 Total | 7635.49749 98 77.9132396 Root MSE = 1.3251
------------------------------------------------------------------------------ le | Coef. Std. Err. t P>|t| [95% Conf. Interval] -------------+---------------------------------------------------------------- sp_year1 | .4347183 .0125385 34.67 0.000 .4098296 .459607 sp_year2 | -.1845163 .015519 -11.89 0.000 -.2153213 -.1537113 _cons | -778.6582 24.14547 -32.25 0.000 -826.5865 -730.7298 ------------------------------------------------------------------------------
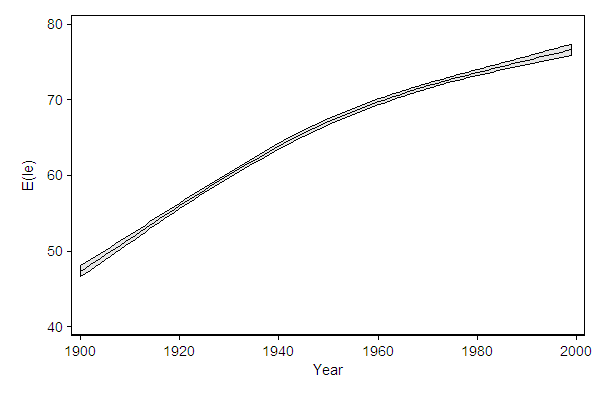
. adjustrcspline
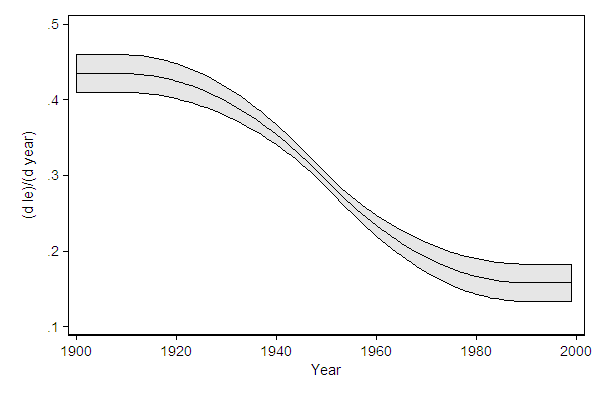
. mfxrcspline
. .
Adding extra options to make the graph look pretty
. sysuse uslifeexp, clear (U.S. life expectancy, 1900-1999)
. mkspline2 sp_year = year, cubic nknots(3)
. qui reg le sp_year* if year != 1918
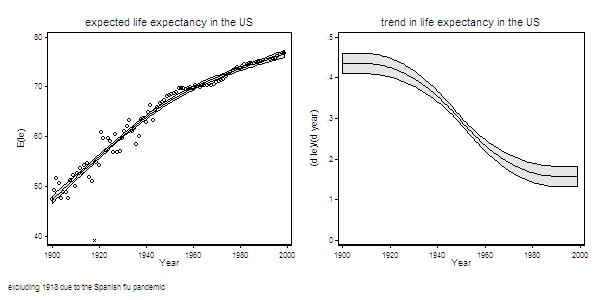
. adjustrcspline, /// > addplot(scatter le year if year != 1918, msymbol(Oh)|| /// > scatter le year if year == 1918, msymbol(X)) /// > name(pred, replace) /// > title("expected life expectancy in the US")
. . mfxrcspline, /// > name(mfx, replace) /// > ylab(0(.1).5) /// > title("trend in life expectancy in the US")
. . graph combine pred mfx, /// > ysize(3) /// > note("excluding 1918 due to the Spanish flu pandemic")