proprcspline: module for restricted cubic spline smoothing of proportions.
Author: Maarten L. Buis
Description
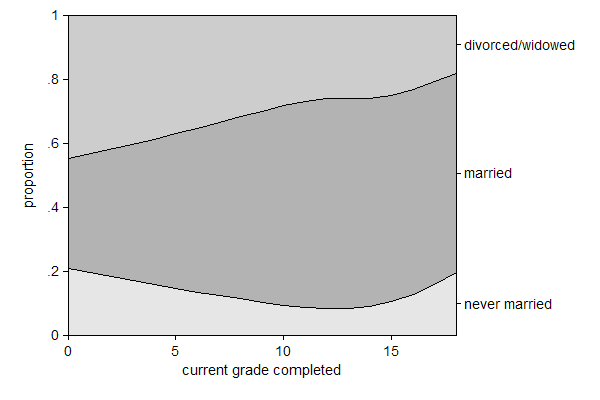
proprcspline computes a restricted cubic spline smooth of proportions of observations in each category of a dependent/response/explained variable given an independent/predictor/explanatory variable, and graphs these smoothed proportions as a stacked area plot.
This package can be installed by typing in Stata: ssc install proprcspline
Supporting material
- summary on ssc.
- helpfile
- Announcement of proprcspline on statalist.
- Certification script for version 1.2.3
Examples
Illustrating the basic syntax and the resulting graph (I used the lean1 scheme):
. sysuse nlsw88, clear (NLSW, 1988 extract)
. . gen marst = cond(never_married, 1, /// > cond(married, 2, 3)) /// > if !missing(married, never_married)
. label define marst 1 "never married" /// > 2 "married" /// > 3 "divorced/widowed"
. label value marst marst
. . proprcspline marst grade, xlab(0(5)15)

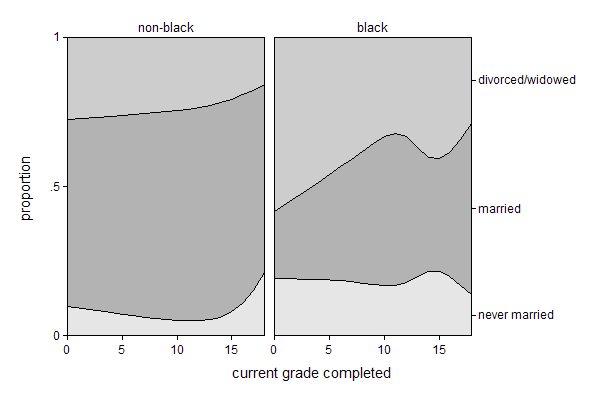
Illustrating the by() option:
. sysuse nlsw88, clear (NLSW, 1988 extract)
. . gen marst = cond(never_married, 1, /// > cond(married, 2, 3)) /// > if !missing(married, never_married)
. label define marst 1 "never married" /// > 2 "married" /// > 3 "divorced/widowed"
. label value marst marst
. . gen black = race == 2 if race < .
. label define black 1 "black" /// > 0 "non-black"
. label value black black
. . proprcspline marst grade, xlab(0(5)15) /// > by(black, note(""))
