qenv
Authors: Maarten L. Buis and Nicholas J. Cox
This package contains programs that each generate two numeric variables for later plotting on a quantile-quantile plot that define an envelope of low and high expectations for each quantile given repeated sampling from a specified distribution with the same number of values and same parameter values as the data specified. The programs are helper programs designed for use with qplot, which must be installed separately. (Type in Stata findit qplot to get references and code sources.) The package includes qenvnormal, qenvgamma, qenvchi2, qenvF, and qenvbeta, to compute bounds for respectively the normal, gamma, chi-square, F, and beta distribution.
This package can be installed by typing in Stata: ssc install qenv
Examples
. sysuse auto, clear (1978 Automobile Data)
. . qenvnormal weight, gen(lower upper) reps(20000)
. . su weight
Variable | Obs Mean Std. Dev. Min Max -------------+-------------------------------------------------------- weight | 74 3019.459 777.1936 1760 4840
. scalar mean = r(mean)
. scalar sd = r(sd)
. . qplot weight lower upper, ms(oh none ..) c(. l l ) /// > ytitle("Weight, lb") xtitle(Normal quantiles) /// > trscale(`=mean' + `=sd' * invnormal(@))
.
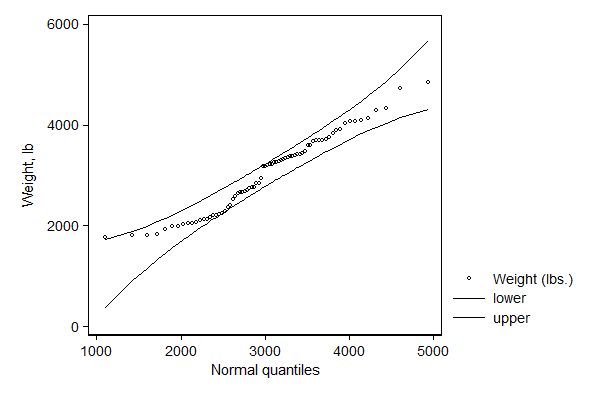
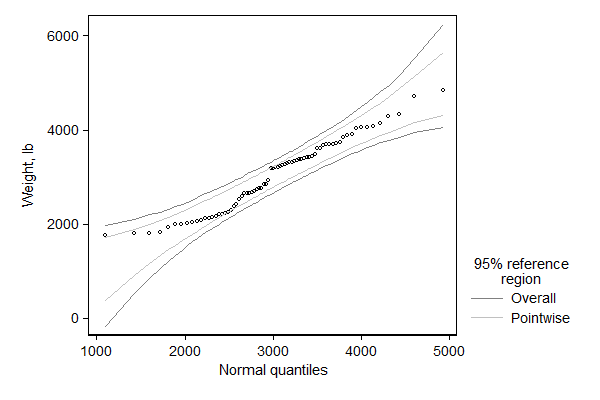
The graph above displays the 95% point-wise reference region, which is the region of acceptance for each quartile separately. The probability that in a variable an observation falls outside this envelope is much larger than 95%. When specifying the overall option an envelope will be computed such that the overall error rate will be approximately 95%. The two are compared in the example below.
. sysuse auto, clear (1978 Automobile Data)
. . qenvnormal weight, gen(lower upper) reps(20000)
. qenvnormal weight, overall reps(20000) gen(lower2 upper2)
. . su weight
Variable | Obs Mean Std. Dev. Min Max -------------+-------------------------------------------------------- weight | 74 3019.459 777.1936 1760 4840
. scalar mean = r(mean)
. scalar sd = r(sd)
. . qplot weight lower2 upper2 lower upper, ms(oh none ..) /// > c(. l l l l) lc(gs8 gs8 gs8 gs12 gs12) /// > legend(order(2 "Overall" 4 "Pointwise") /// > subtitle("95% reference" "region") ) /// > ytitle("Weight, lb") xtitle(Normal quantiles) /// > trscale(`=mean' + `=sd' * invnormal(@))
.